Quantitative Mapping of Keratin Networks in 3D
Windoffer R, Schwarz N, Yoon S, Piskova T, Scholkemper M, Stegmaier J, Bönsch A, Di Russo J, Leube RE
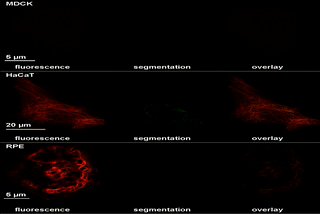
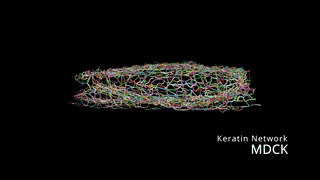
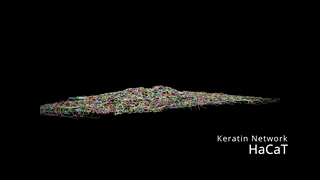
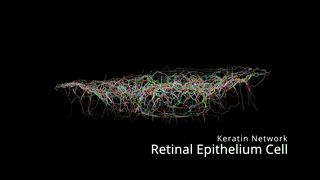
Mechanobiology requires precise quantitative information on processes taking place in specific 3D microenvironments. Connecting the abundance of microscopical, molecular, biochemical and cell mechanical data with defined topologies has turned out to be extremely difficult. Establishing such structural and functional 3D maps needed for biophysical modeling is a particular challenge for the cytoskeleton, which consists of long and interwoven filamentous polymers coordinating subcellular processes and interactions of cells with their environment. To date, useful tools are available for the segmentation and modeling of actin filaments and microtubules but comprehensive tools for the mapping of intermediate filament organization are still lacking. In this work, we describe a workflow to model and examine the complete 3D arrangement of the keratin intermediate filament cytoskeleton in canine, murine and human epithelial cells both, in vitro and in vivo. Numerical models are derived from confocal Airyscan high resolution 3D imaging of fluorescence-tagged keratin filaments. They are interrogated and annotated at different length scales using different modes of visualization including immersive virtual reality. In this way, information is provided on network organization at the subcellular level including mesh arrangement, density and isotropic configuration as well as details on filament morphology such as bundling, curvature and orientation. We show that the comparison of these parameters helps to identify, in quantitative terms, similarities and differences of keratin network organization in epithelial cell types defining subcellular domains, notably basal, apical, lateral and perinuclear systems. The described approach and the presented data are pivotal for generating mechanobiological models that can be experimentally tested.