Measuring the regulation of keratin filament network dynamics
Moch M, Herberich G, Aach T, Leube RE, Windoffer R, 2013
The organization of the keratin intermediate filament cytoskeleton is closely linked to epithelial function. To study keratin network plasticity and its regulation at different levels, tools are needed to localize and measure local network dynamics. In this paper, we present image analysis methods designed to determine the speed and direction of keratin filament motion and to identify locations of keratin filament polymerization and depolymerization at subcellular resolution. Using these methods, we have analyzed time-lapse fluorescence recordings of fluorescent keratin 13 in human vulva carcinoma-derived A431 cells.
The fluorescent keratins integrated into the endogenous keratin cytoskeleton, and thereby served as reliable markers of keratin dynamics. We found that increased times after seeding correlated with down-regulation of inward-directed keratin filament movement. Bulk flow analyses further revealed that keratin filament polymerization in the cell periphery and keratin depolymerization in the more central cytoplasm were both reduced. Treating these cells and other human keratinocyte-derived cells with EGF reversed all these processes within a few minutes, coinciding with increased keratin phosphorylation.
These results highlight the value of the newly developed tools for identifying modulators of keratin filament network dynamics and characterizing their mode of action, which, in turn, contributes to understanding the close link between keratin filament network plasticity and epithelial physiology.
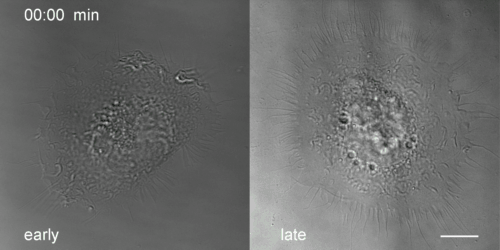
Direct comparison of AK13-1 cells at early and late time points after seeding. First, differential interference contrast images are shown, high-lighting the pronounced ruffling activity at the early time point and the presence of prominent retraction fibers at the late time point. The sequence of fluorescence micrographs then depicts the differences in keratin network dynamics at the different time points after seeding. Finally, the overlay of interference contrast images and fluorescence micrographs is shown. Images were recorded every 30 s for 15 min. (Scale bar, 10 μm.)
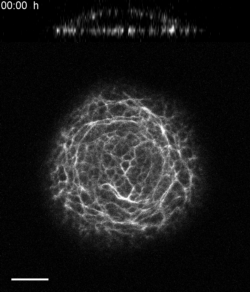
Three-hour 3D recording of a single AK13-1 cell producing fluorescent human keratin 13. The 13 optical sections are either presented as a projection view (Lower) or as a cross-section (Upper). Note the ongoing inward movement of keratin filaments but the absence of accumulation of keratin filaments in the cell center. Image stacks were recorded every 10 min. (Scale bar, 10 μm.)
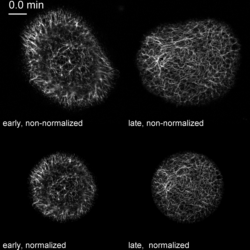
Fluorescence image series of single AK13-1 cells examined either 24 h after seeding (Left) or 48 h after seeding (Right) used to prepare the speed heat maps, vector maps, and bulk flow images shown in Fig. 2 A, C, and E (Top and Middle). The nonnormalized cells (Upper) and normalized cells (Lower) are shown. Confocal fluorescence images of fluorescent human keratin 13-EGFP were recorded every 30 s for 15 min. (Scale bar, 10 μm.)
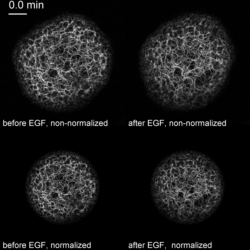
Fluorescence recording of a single AK13-1 cell before (Left) and immediately after (Right) addition of 20 ng/mL EGF. The nonnormalized recording of the human keratin 13-EGFP fluorescence (Upper) and the corresponding normalized images (Lower) are shown. Micrographs were recorded every 30 s for 15 min before and for 15 min after addition of EGF. (Scale bar, 10 μm.)